Generate PDF with Charts using HTML in PDF.co and Zapier
In this tutorial, we will show you how to generate PDF with charts using HTML in PDF.co and Zapier.
We will use this Google Sheet data to generate PDFs with charts.
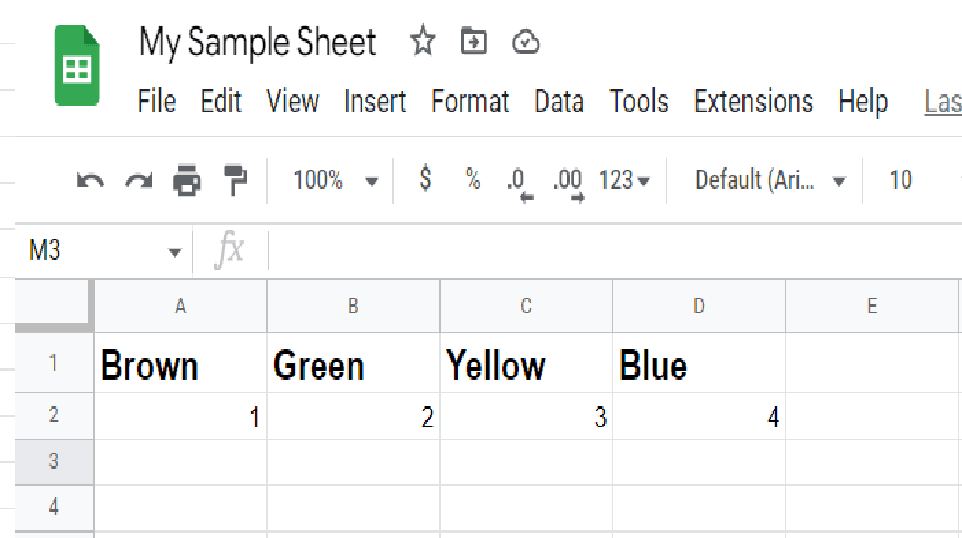
Step 1: Create a Zap
First, log in to your Zapier account and create a Zap.
Step 2: Trigger App and Event
Next, select the Google Sheets app and choose the New Spreadsheet Row as a trigger.
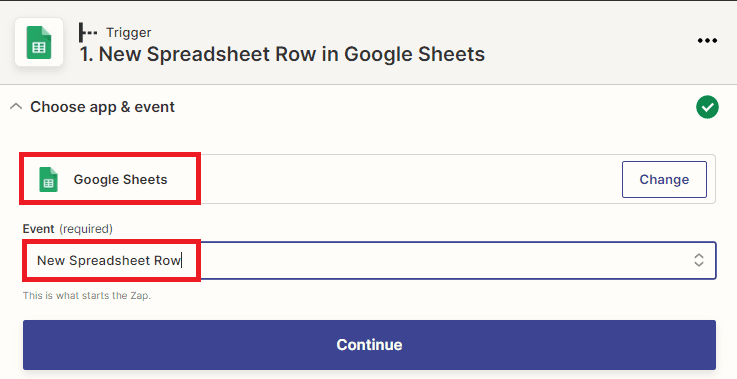
Step 3: Setup Trigger
Let’s set up the trigger.
- In the Spreadsheet field, enter the spreadsheet name you created.
- In the Worksheet field, select the sheet where the data is located.
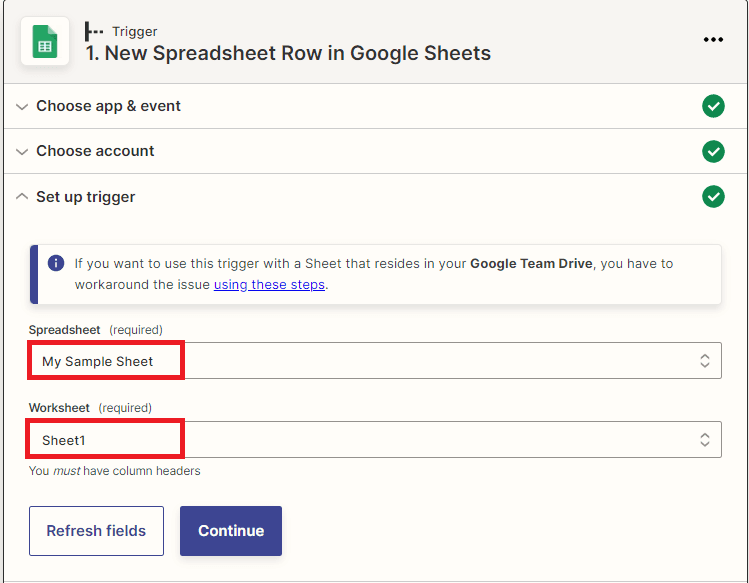
Then, click the test trigger button.
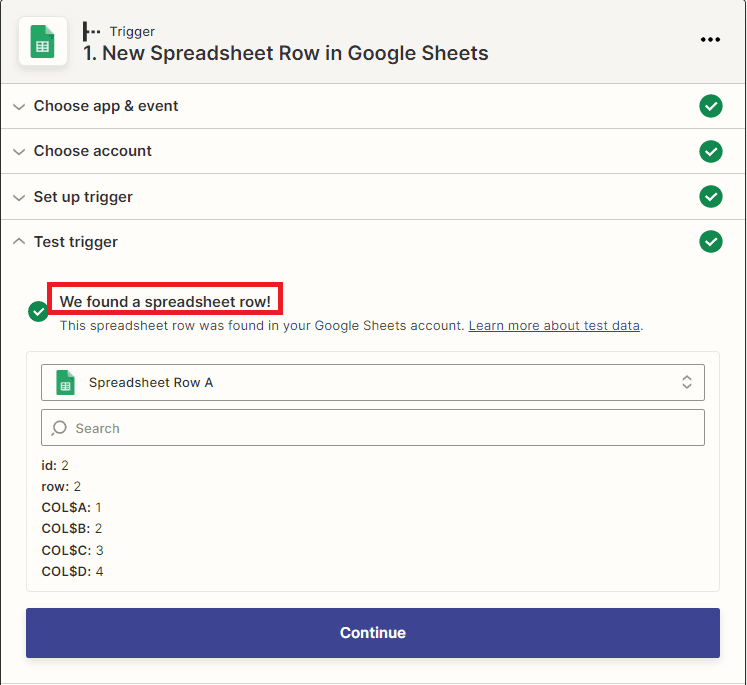
Step 4: Test Trigger Result
Once the test trigger is successful, move on to the action event.
Step 5: Action App and Event
Kindly select the PDF.co app and choose the HTML to PDF Converter for the action event.
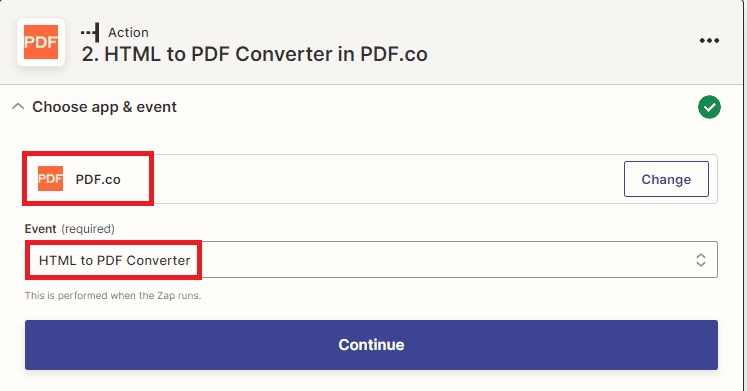
Step 6: Setup Action
Let’s set up the Action.
- In the Input HTML or URL to convert field, input your HTML code together with the Google Sheet data.
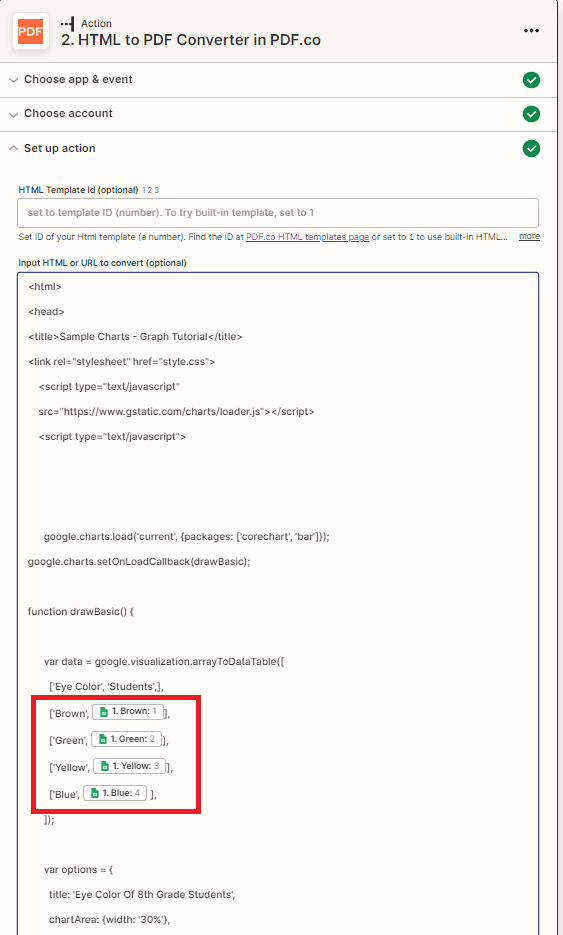
HTML Sample
<html>
<head>
<title>Sample Charts – Graph Tutorials</title>
<link rel=”stylesheet” href=”style.css”>
    <script type=”text/javascript”
    src=”https://www.gstatic.com/charts/loader.js”></script>
    <script type=”text/javascript”>
      google.charts.load(‘current’, {packages: [‘corechart’, ‘bar’]});
google.charts.setOnLoadCallback(drawBasic);
function drawBasic() {
      var data = google.visualization.arrayToDataTable([
        [‘Eye Color’, ‘Students’,],
        [‘Brown’, 1],
        [‘Green’, 2],
        [‘Yellow’, 3],
        [‘Blue’, 4],
      ]);
      var options = {
        title: ‘Eye Color Of 8th Grade Students’,
        chartArea: {width: ‘30%’},
        hAxis: {
          title: ‘Eye Color’,
          minValue: 0
        },
        vAxis: {
          title: ‘Number of Students’
        }
      };
      var chart = new google.visualization.BarChart(document.getElementById(‘chart_div’));
      chart.draw(data, options);
    }
    </script>
</head>
<body>
    <div id=”chart_div” class=”chart”></div>
</body>
</html>
After setting up, click the test and review button.
Step 7: Test Result
Great! Our test was a success. You may copy the URL and paste it into your browser to view the output.
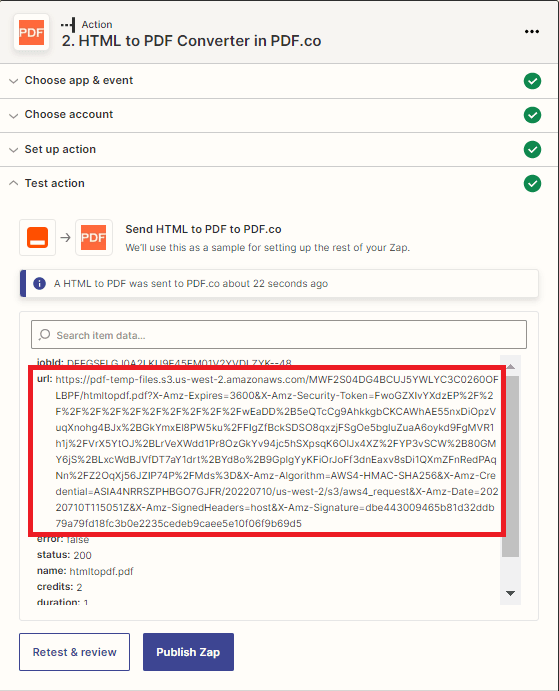
Step 8: Output
Here’s the generated PDF with charts from Google Sheet data.

In this tutorial, you learned how to generate PDFs with charts using HTML in Zapier. You learned how to use the PDF.co Web API to generate PDF. You also learned how to use the HTML to PDF Converter to convert HTML into PDF.
Video Guide
Related Tutorials
